The 2026 Boom & Bust Report has landed, and it cuts through the noise better than anything we’ve seen this year. For investors, it paints the picture of a market steadier than the headlines suggest—yet full of nuance depending on city, affordability, and asset type. With population growth moderating, interest rates nearing their peak, and a widening divergence emerging between states, the next 12–18 months will reward those who make informed, strategic decisions rather than waiting on perfect conditions. This week’s wrap breaks down the key forces shaping 2026, what each scenario means for buyers and owners, and how to position ahead of the next cycle shift.
Regional markets like the Sunshine Coast and Whitsundays remain tight with strong growth.
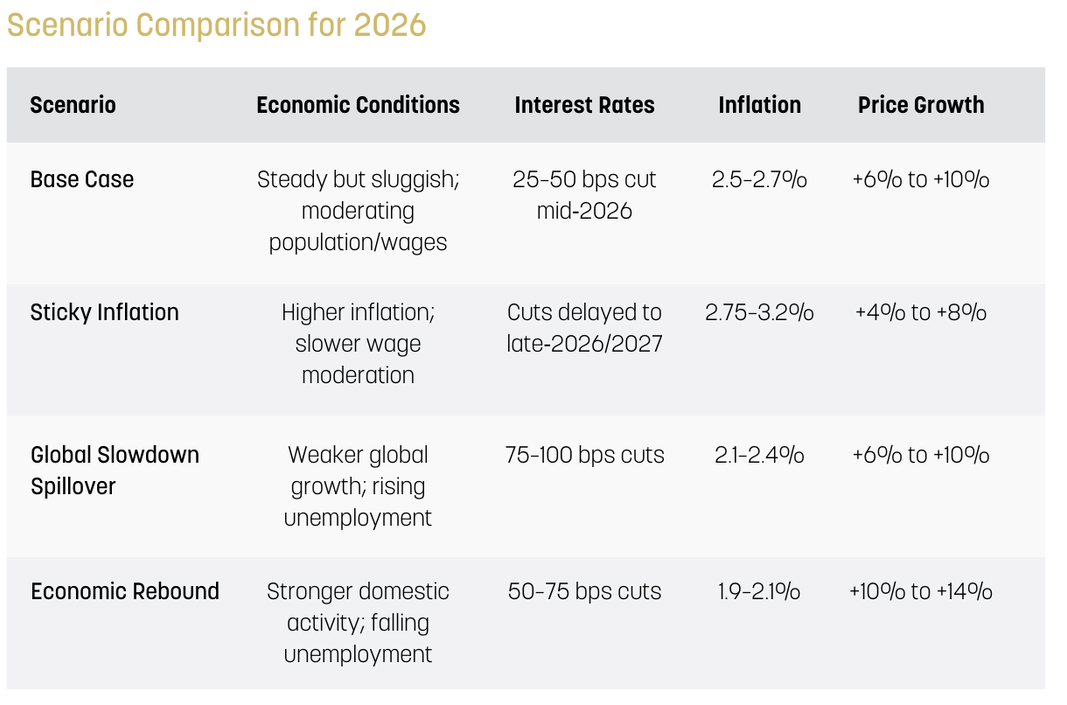
The key drivers of price growth remain population, interest rates, and employment—supported by relative affordability, interstate migration, and local supply volumes.
Primary risks to the outlook include sticky inflation delaying rate cuts, economic weakness affecting affordability, and population growth undershooting while completions remain elevated.
“In times of inflation, when central banks fail to lift rates to meet it, real assets such as gold and real estate hold their value while questionable assets don’t.”
Comments on the Report
Even the “worst-case” scenario remains broadly positive, with price growth expected to beat inflation—though outcomes will vary widely by state and suburb.
• Affordability, while not heavily emphasised in the report, will increasingly decide where growth concentrates.
• The yield curve has normalised into its traditional upward slope, and money markets are suggesting rates may be at or near their floor. The report doesn’t model the possibility of a rate increase—unlikely, but not impossible.
• Gold and property outperform during inflation for a reason: property is essential, and gold represents real money. Comparing property values to their cost in ounces of gold is a meaningful way to understand real value shifts over time.
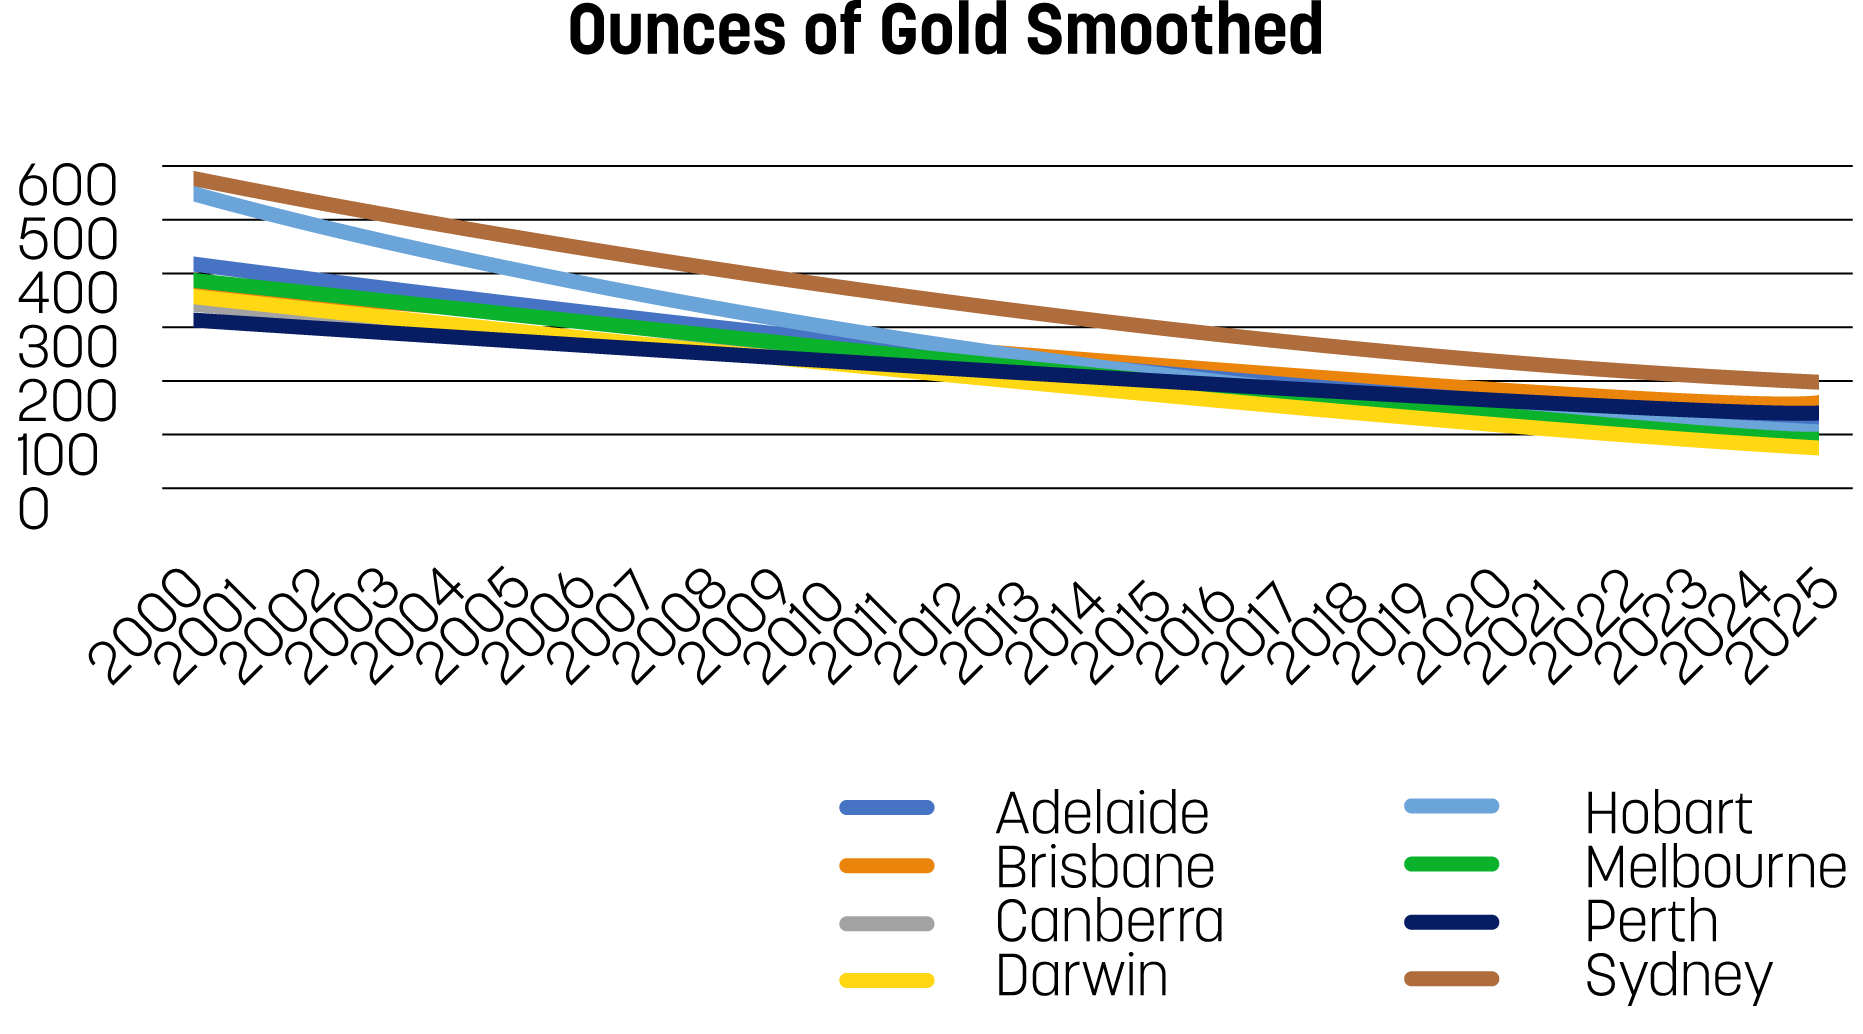
While the gold price fluctuates, smoothing the volatility shows a fascinating trend. In 2000, with gold at roughly $300 per ounce, it took far fewer ounces to buy a home compared with today, where gold sits around $6,000 per ounce. When measured in gold, Australian property has actually fallen in value—suggesting that the idea of a property “bubble” is less about rising prices and more about declining purchasing power. We are taking longer to pay off homes because our money is worth less, not because real property values are exploding.
The takeaway from the Boom & Bust Report is straightforward: even under conservative conditions, property remains one of the few assets expected to outperform inflation. But the gap between cities, suburbs and asset types will widen materially. Affordability will shape the next growth phase, and investors who are selective, analytical and forward-looking will capture the best opportunities.
If you’d like help understanding how these forecasts apply to your personal strategy—or clarity on which suburbs and asset classes are best placed to outperform across the scenarios—reach out for a strategy call. Our team is on the ground daily in Melbourne, Sydney and Brisbane, and we’d be happy to step you through where we see the strongest opportunities for 2025 and 2026.